- The Blueprint
- Posts
- Sellers start to lower asking prices – finally!
Sellers start to lower asking prices – finally!
Plus, states where foreclosures close the fastest
Rinku Mathew
July 18, 2025
Realty vs Reality
One of the big themes of 2025 so far: the gap in the market between what people think is going on and what the numbers show.
As you’ll see in today’s second story, we might be seeing signs that sellers are starting to come to terms with the reality of this buyer’s market. We’ll give you the latest data, and tell you why these signs are encouraging.
In our third story, we talk about the realities of the foreclosure market. We know many people are always curious about this area of the business, and there are a lot of nuances to understand, specifically the length of the process and how it varies by state. We’ll break it all down below.
And, as we’re at the middle of the year, we want to motivate all agents to make sure they are looking at the reality of their business. The hard numbers. In today’s Foundation Plans, we give you some quick pointers on how to track what’s really going on in your business. This way, you can feel fully prepared for the rest of the year.
With that, let’s dig into today’s Blueprint!
- James and David
NAR expects home sales to increase by 3% in 2025

Source: Unsplash
At NAR’s Forecast Summit, Chief Economist Lawrence Yun projected that 2025 home sales will increase by 3% and surge by 14% in 2026. But there’s a big IF in that projection. It depends on 30-year mortgage rates falling to 6% by year-end.
This projection is another downgrade from Yun’s previous projections. In November, he forecast home sales to grow 9% in 2025, then in March, he downgraded it to 6%.
Here are the other key takeaways from the forecast summit.
First-time buyers now make up just 24% of home purchases — the lowest share on record — due to affordability challenges.
Migration to the South and Sun Belt remains strong, but the West and Midwest are seeing faster year-over-year growth.
Utah, Washington, and Nevada posted the biggest migration gains, while Texas remains the top destination, though its growth is slowing.
Our take
It’s important to see the context here. Just last November, Yun was projecting 9% home sales growth, and now that’s down to 3%, and only if mortgage rates drop. The latest forecast pins a 14% sales surge in 2026 on rates hitting 6%, but again, that’s a big “if.” While we appreciate NAR’s optimism, we think these projections may be too rosy. The market is still facing affordability hurdles, sluggish buyer demand, and high borrowing costs. Until those fundamentals shift, real recovery may be slower and more uneven than expected.
Growth in seller asking prices slows

The median U.S. asking price just posted its smallest increase since the start of 2025, as more sellers face the realities of a buyer’s market. According to Redfin, the median asking price during the four weeks ending July 13 was $407,000 — up 2.9% year over year, the slowest growth in over four months. Here’s what else the listing service reports:
The median home-sale price is $401,120 — about $6K below the asking price
Sale prices are up just 1.7% year over year
44% of sellers are offering buyer concessions, just under the record 45.1% from early 2023
New listings are down nearly 1% YoY — the biggest drop of 2025
Supply is up: total homes for sale rose 12%, while pending sales slipped 2%
Redfin expects the median sale price to fall 1% YoY by the end of 2025
The typical monthly mortgage payment is now $2,699 (at a 6.72% rate) — the lowest in 4 months
Our take
We don’t want to be Pollyannaish about it, but this is the first real sign that sellers are getting it. The slowdown in asking-price growth — along with the narrowing gap between list and sale prices — suggests sellers are finally coming to terms with the reality of today’s buyer’s market. We won’t be fully convinced until delisting rates drop and the gap between sale and asking prices shrinks even further, but these are encouraging signs. Concessions are near record highs, price cuts are rising, and Redfin expects home prices to fall by year-end. It’s not a collapse, but it is a shift in leverage. For buyers sidelined by high prices, this may be the first real opening in over a year.
States with the shortest foreclosure process timelines
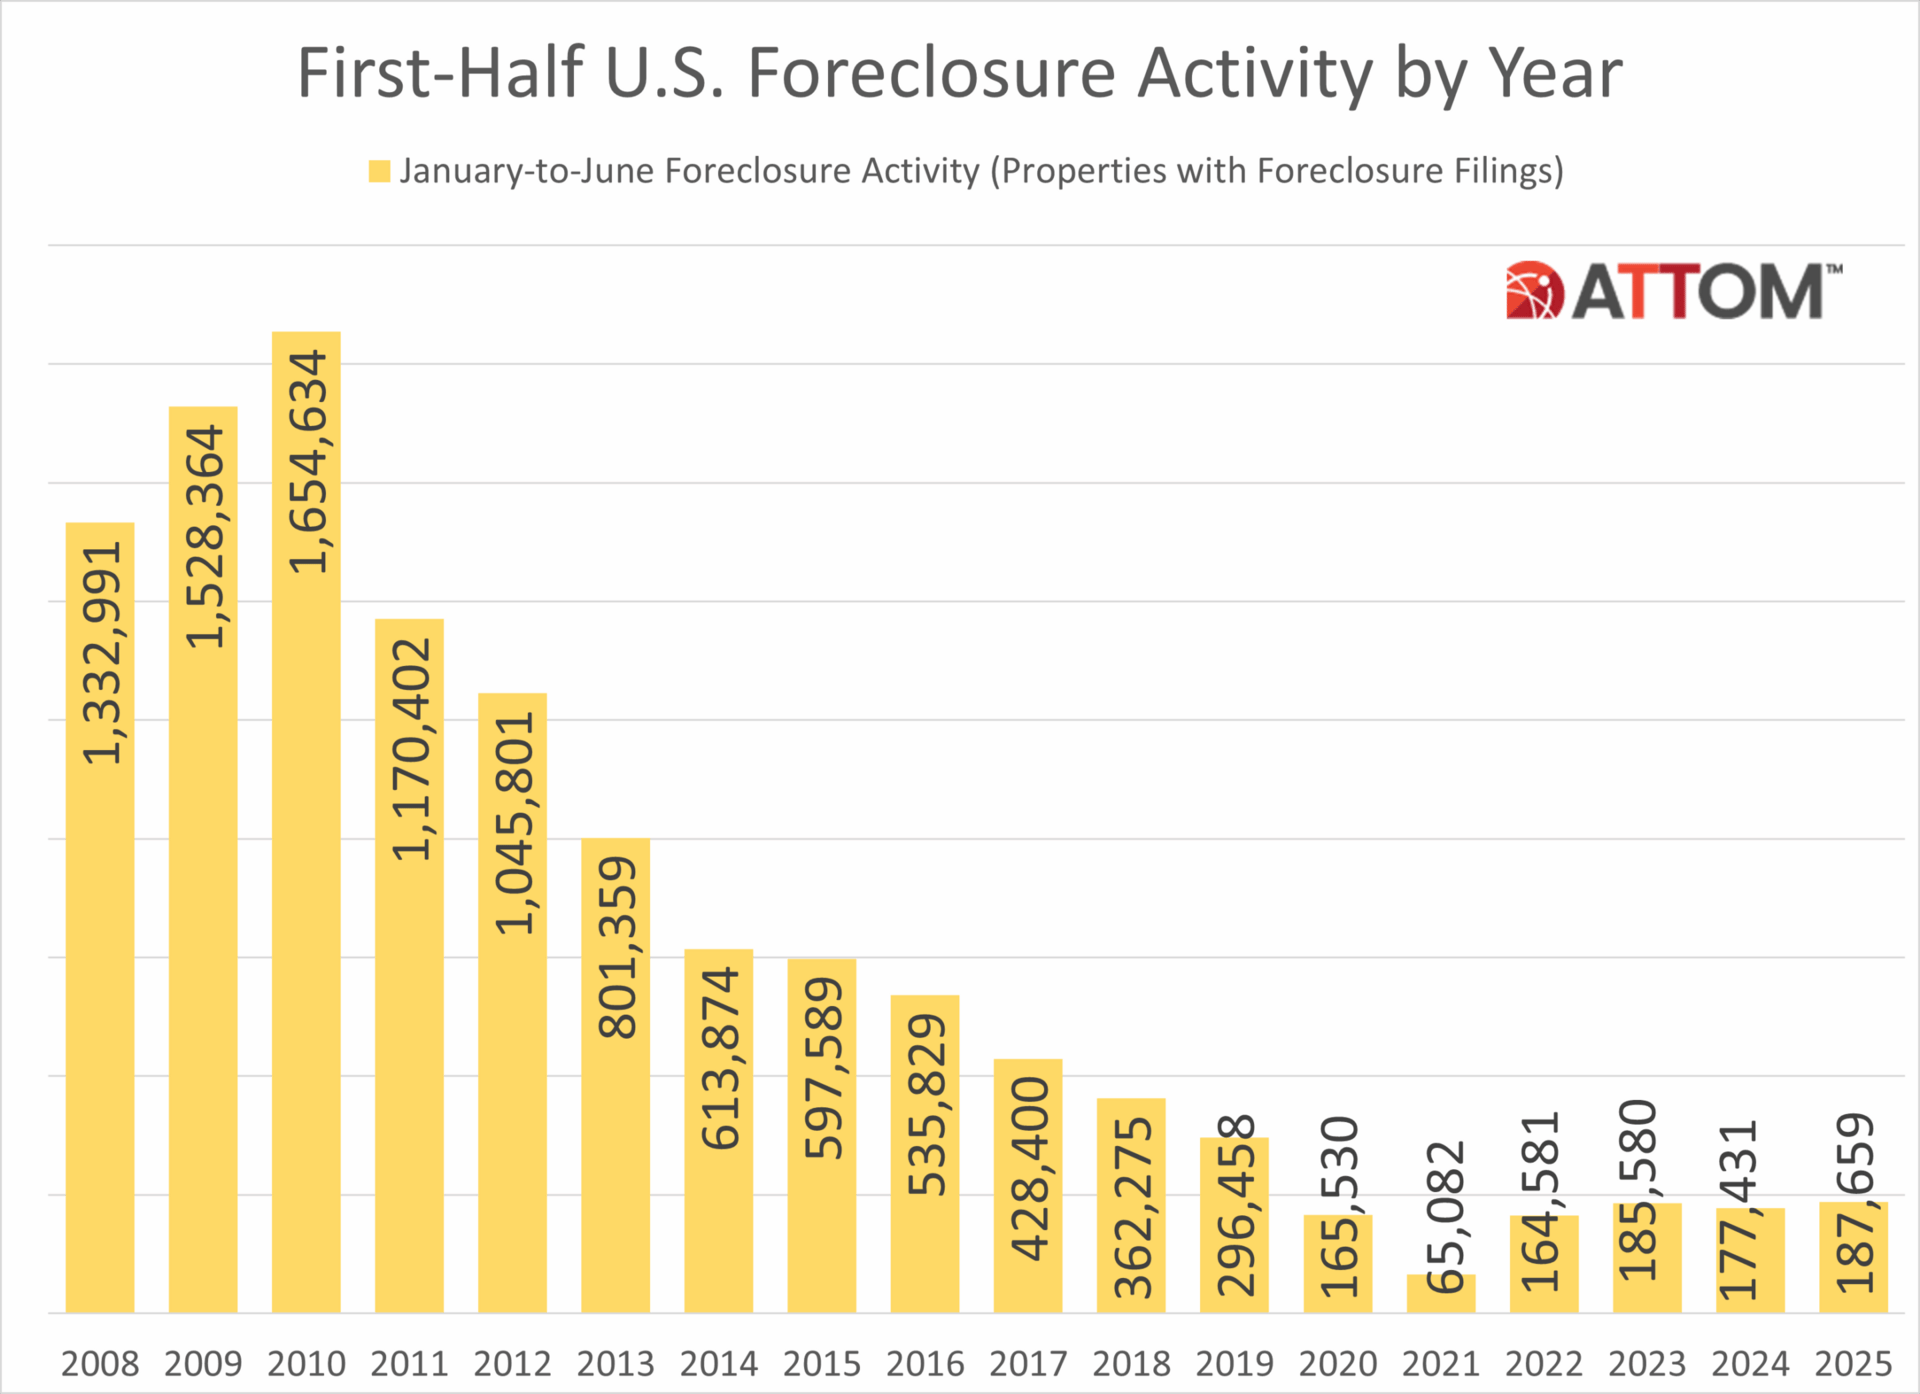
Source: ATTOM
Foreclosure activity continued to rise in the first half of 2025, with 187,659 U.S. properties recording foreclosure filings — up 5.8% from a year ago and 1.1% from two years ago, according to ATTOM’s Mid-Year Foreclosure Report.
Completed foreclosures (REOs) also rose, with lenders repossessing 21,007 properties — a 12% increase from the first half of 2024, though still 7% below 2023 levels. States with the highest number of REOs were Texas (2,207), California (1,799), Pennsylvania (1,461), Illinois (1,439), and Michigan (1,260).
Foreclosure timelines varied dramatically across the country. On average, properties foreclosed in Q2 2025 spent 645 days in the foreclosure process, down 4% from Q1 and 21% from a year ago.
Here are the states with the shortest and longest average foreclosure timelines:
Shortest Timelines | Longest Timelines |
Our take
Foreclosure filings are rising, but still below pre-pandemic levels. That’s a signal of strain, not crisis. The real story is in the timelines. In states like Wyoming and Texas, foreclosures wrap up in months, while in Louisiana, they can drag on for nearly a decade. For investors and asset managers, these differences are critical. Fast timelines offer quicker turns; slow ones mean higher holding costs, elevated risk, and delayed returns. Understanding this spread is key in today’s uneven foreclosure landscape. Make sure you share this intel with your investor clients.
Schematics
The news that just missed the cut

Source: Unsplash
Things are heating up between Andy Florence and Zillow
Best practices for AI prospecting and branding
Will tariffs raise mortgage rates? – Here’s what to know.
The best FREE CRM’s for real estate
Set yourself up for success: Don’t be that agent who CAN’T retire
Foundation Plans
Advice from James and David to win the day

Real estate is a people business, but it’s also a numbers game. That’s why tracking your stats is non-negotiable. Without them, you won’t know whether you’re hitting your goals, and if you need to recalibrate them. One of the privileges of this career is being your own boss, but that also means you’re responsible for your results. Today, we’re going over some key metrics you need to be tracking to do that.
Year-over-year production – Compare your current performance to the previous year. This metric provides invaluable insights into whether your performance is aligned with your goals. It’s concrete data that enables you to make strategic adjustments to ensure continuous growth and success.
Active and future listings – Listings are king in real estate. Understanding current active listings provides insights into market trends, pricing strategies, and property availability. Future listings help in planning and preparing for upcoming opportunities. Being aware of active and future listings allows you to better match client needs with available properties, offer more tailored and timely options, and enhance customer satisfaction.
Conversion rate – It’s vital to know how effective you are in turning inquiries or leads into actual business. Monitoring this conversion rate helps in evaluating the efficiency of sales strategies, identifying areas for improvement in communication or sales techniques, and ultimately optimizing efforts to increase successful deals. This helps maximize your productivity and revenue potential.
Lead flow – We will say this till we’re blue in the face. Never let your pipeline go dry. It’s critical to continuously generate leads, but you also need to know how effectively your marketing tactics are working. To do that, you need to track the number and quality of potential clients, as well as identify which lead sources are most successful. Tracking lead flow helps optimize your time and resources to maximize your chances of securing more deals.
This is just the tip of the iceberg. To learn what other metrics to track, start here.

You don’t need another “motivational moment.” You need a framework that works.
The Estate Elite 90-Day Multi-Million Dollar Listing Challenge gives you a structure to upgrade your business and land your first/next $1M+ listing.
Join now for free and get:
A polished luxury brand and online presence
Weekly post prompts, reels scripts & video walkthroughs
Outreach scripts for agents, buyers & referral partners
Ad templates to attract high-end leads
Live feedback and accountability from our coaching team
You’ll learn directly from us, along with Josh Flagg, Tracy Tutor, Glenda Baker, and Dawn McKenna—the best in the business.
Start with a 30-day free trial. But don’t wait too long—slots are going quickly.
Just in Case
Keep the latest industry data in your back pocket with today’s mortgage rates:
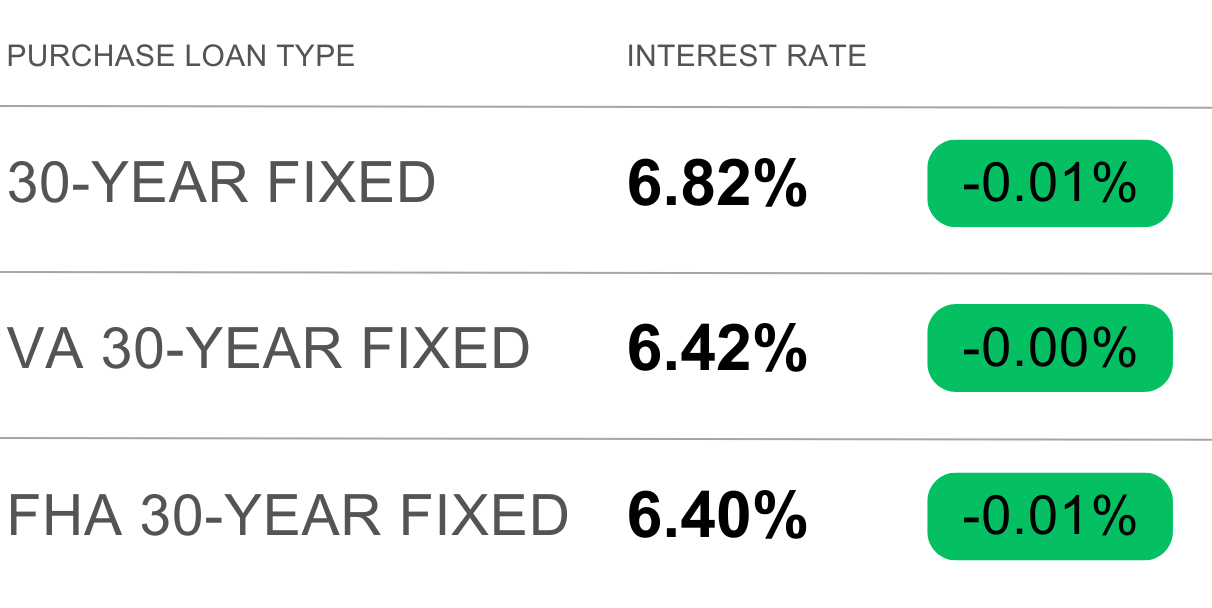
Source: Mortgage News Daily
“Your time is limited, so don’t waste it living someone else’s life.”— Steve Jobs
Each day is a gift – a chance to live the life that you want. Ruthlessly focus on your goals. Don’t let your past or the fear of being judged distract or paralyze you. Choose to live your life with an integrity that you can be proud of.
Have a wonderful weekend, friends! We’ll see you here next week.
- James and David
